📊 Revenue & Sales Dashboard Analysis
📁 Dataset Overview
This project explores a two-year POS dataset (2021–2022) for a bakery chain, focusing on revenue trends, product-level sales analysis, and seasonal behavior insights to support strategic business expansion.
🛠 Tools Used
- Excel: Data preprocessing & calculations
- Tableau: Dashboarding & visual storytelling
🔍 Project Goal
Understand revenue distribution by product and time, uncover peak-performing items, evaluate day-level and seasonal trends, and recommend actionable strategies for profitability and scaling.
🍞 Visual 1: Product & Revenue Overview
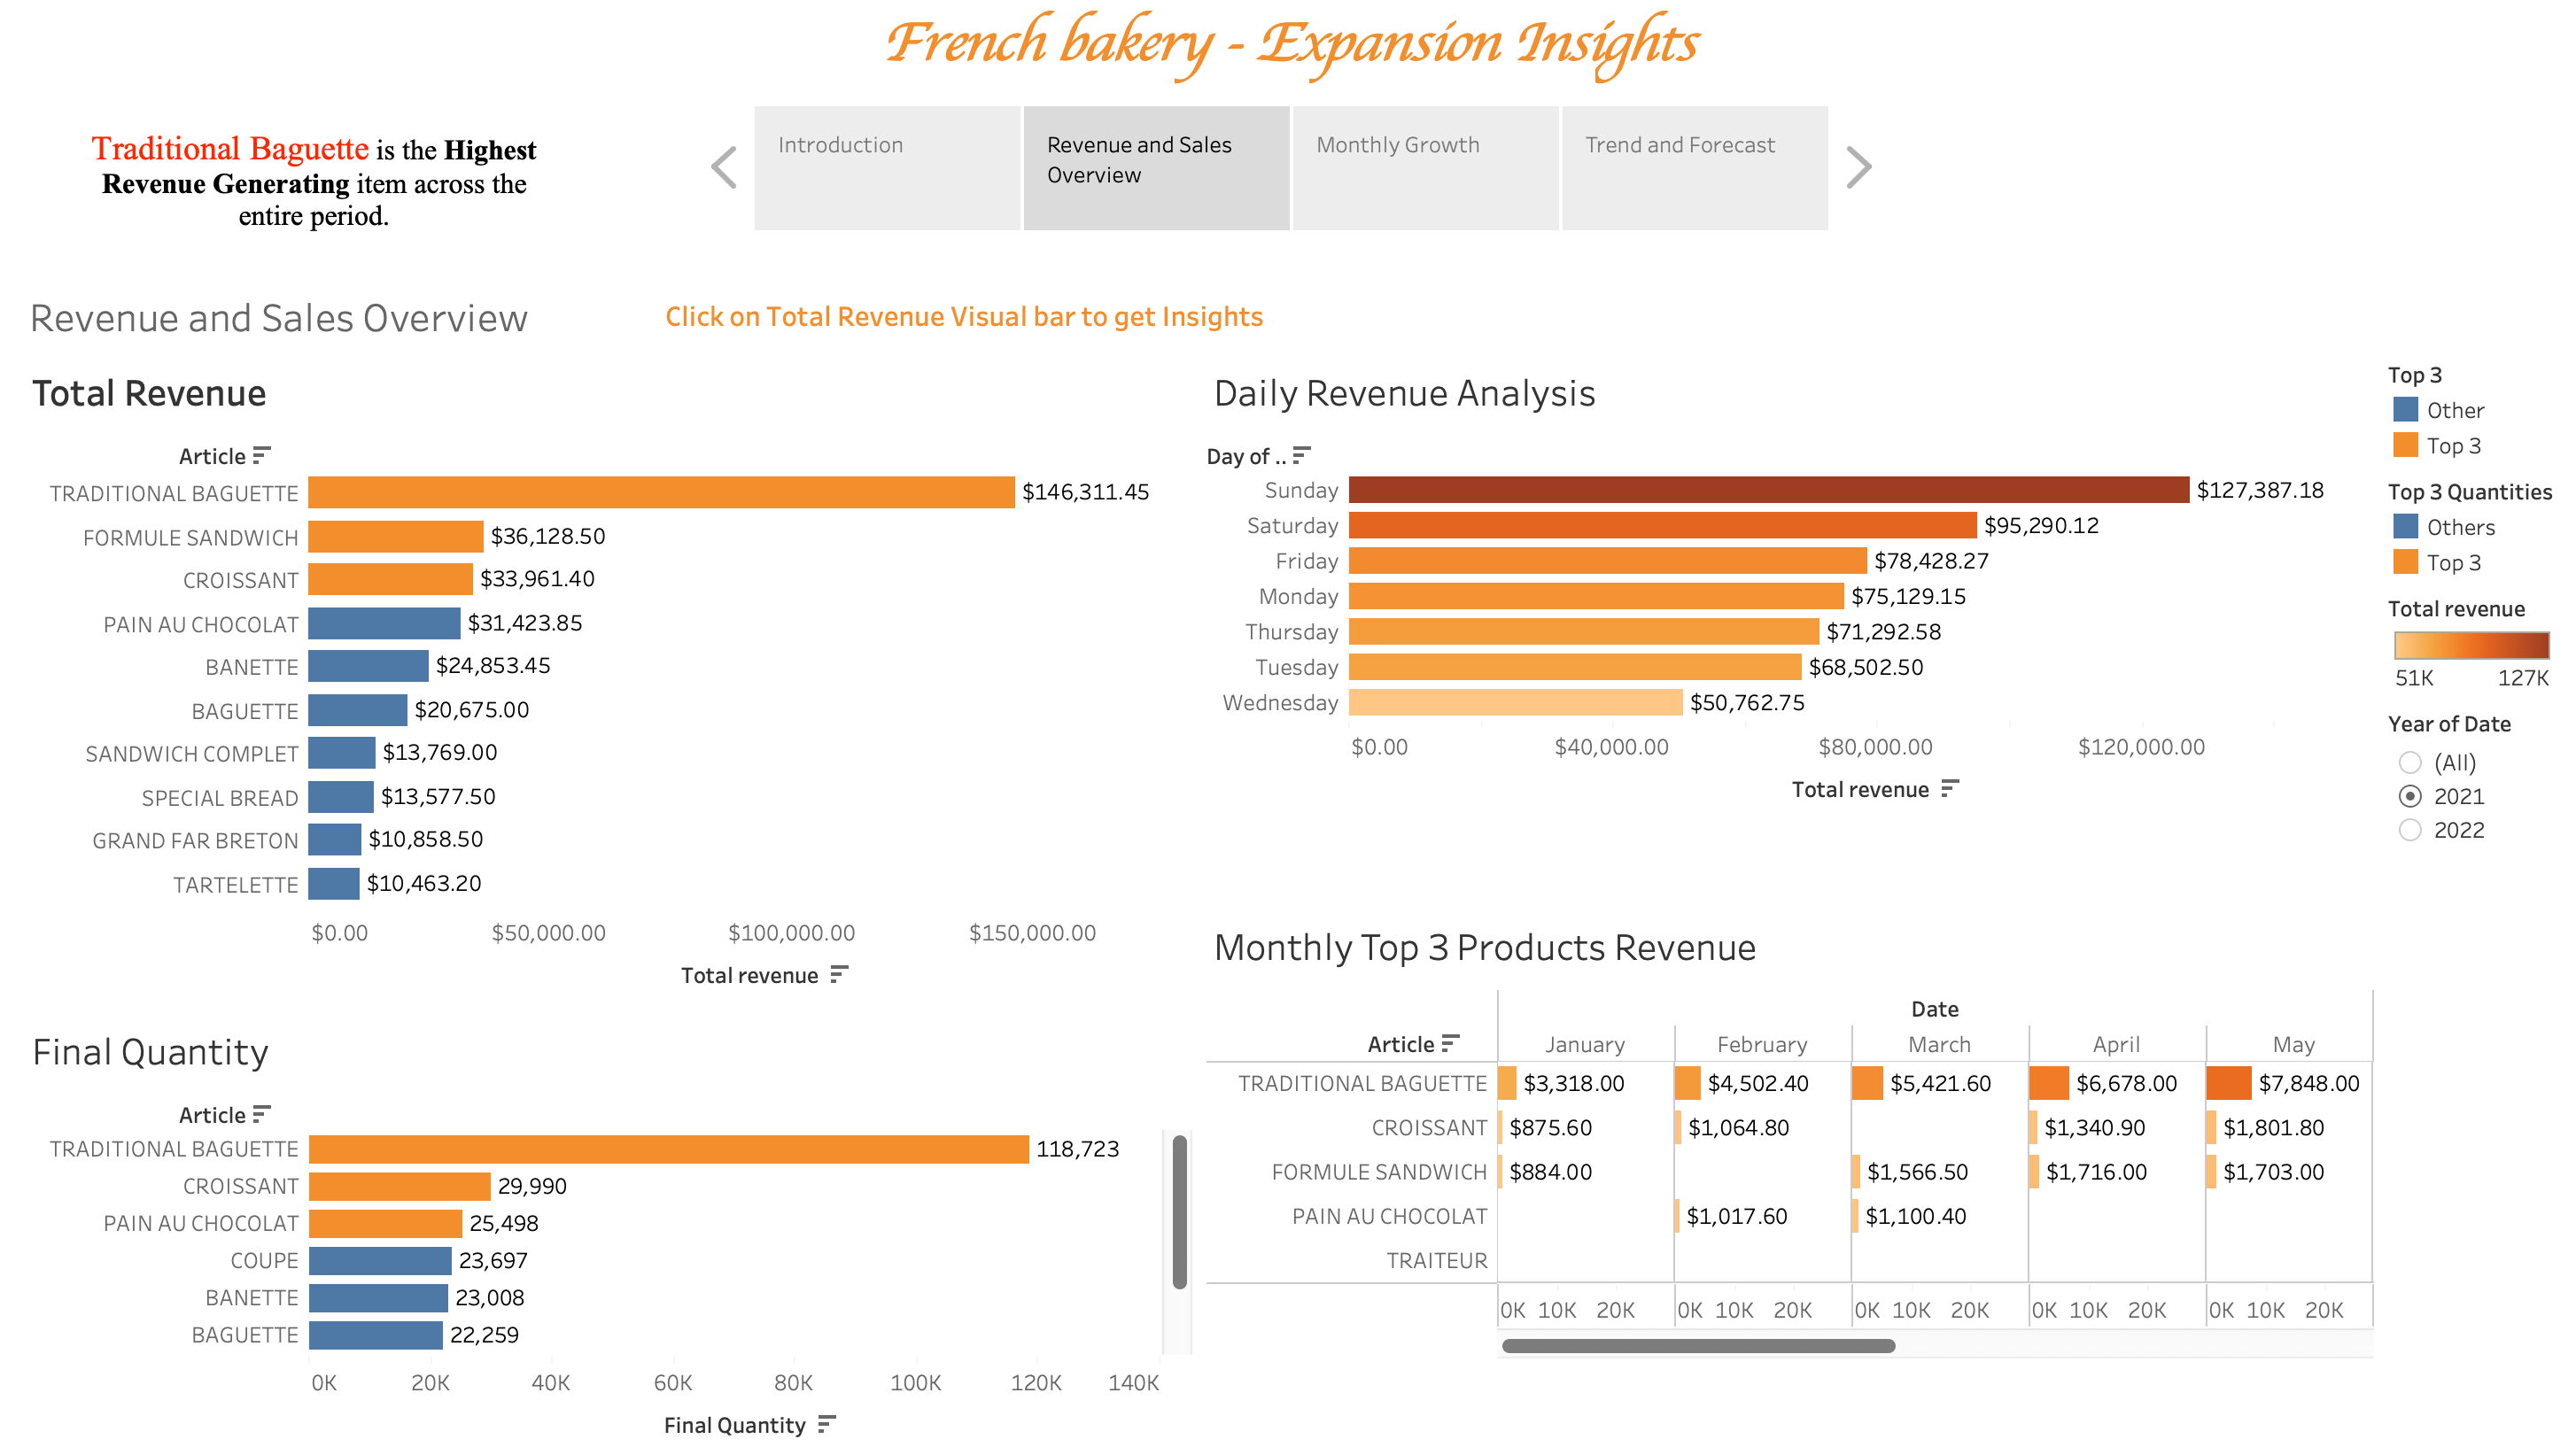
KPI Metrics Overview
| KPI | Value | Description |
|---|---|---|
| Top Revenue Product | Traditional Baguette: $146,311.45 | Highest revenue generated product, significantly outperforming others. |
| Highest Daily Revenue | Sunday: $127,387.18 | Day with the highest total revenue, indicating strong weekend sales. |
| Top Quantity Sold | Traditional Baguette: 118,723 units | Product with the most units sold, showing high demand. |
| Monthly Growth (Baguette) | 137% (Jan to May) | Percentage growth in revenue from January to May, indicating strong upward trend. |
Insights
Revenue Concentration: Revenue is heavily concentrated in the top 3 products, contributing over 60% of total product revenue. The Traditional Baguette alone accounts for more than 40% of all product revenue, with $146,311.45 out of a total of approximately $360,000.
Premium Positioning: Items like Formule Sandwich generate higher revenue ($36,128.50) despite lower quantity (~8,500 units), indicating a higher average price point and potential for premium positioning.
Weekend Peak: Sundays contribute the highest daily revenue ($127,387.18), indicating strong customer behavior patterns tied to leisure or family gatherings.
Consistent Growth: The Traditional Baguette shows a 137% revenue increase from January to May, signaling loyalty or seasonal demand increases.
Recommendations
1. Maximize Sunday Sales: Launch Sunday-specific campaigns, such as discount combos or loyalty offers, to capitalize on the peak revenue day. Given the $127,387.18 revenue, increasing this by even 10% could add $12,700+ in revenue.
2. Scale Top Sellers: Focus on top sellers like the Traditional Baguette, Croissant, and Formule Sandwich for marketing and supply chain prioritization. The Baguette alone contributes $146,311.45, so even a 5% increase in sales would significantly impact revenue.
3. Investigate Low-Revenue Products: Analyze products with low revenue and quantity, such as Tartelette and Grand Far Breton, for potential profit margins or alternative formats. If these can be improved, it can open up a wider revenue stream.
4. Adjust Pricing Strategy: Use value-based pricing for items like Formule Sandwich and revisit pricing elasticity for lagging items. A 10% adjustment in pricing could lead to a 5-15% change in revenue, depending on elasticity.
5. Align Inventory: Boost inventory and staffing for weekend peaks, especially Sunday, and explore flash discounts midweek to flatten the dip. Proper alignment can reduce lost sales and increase efficiency.
📅 Visual 2: Monthly Growth & Seasonality
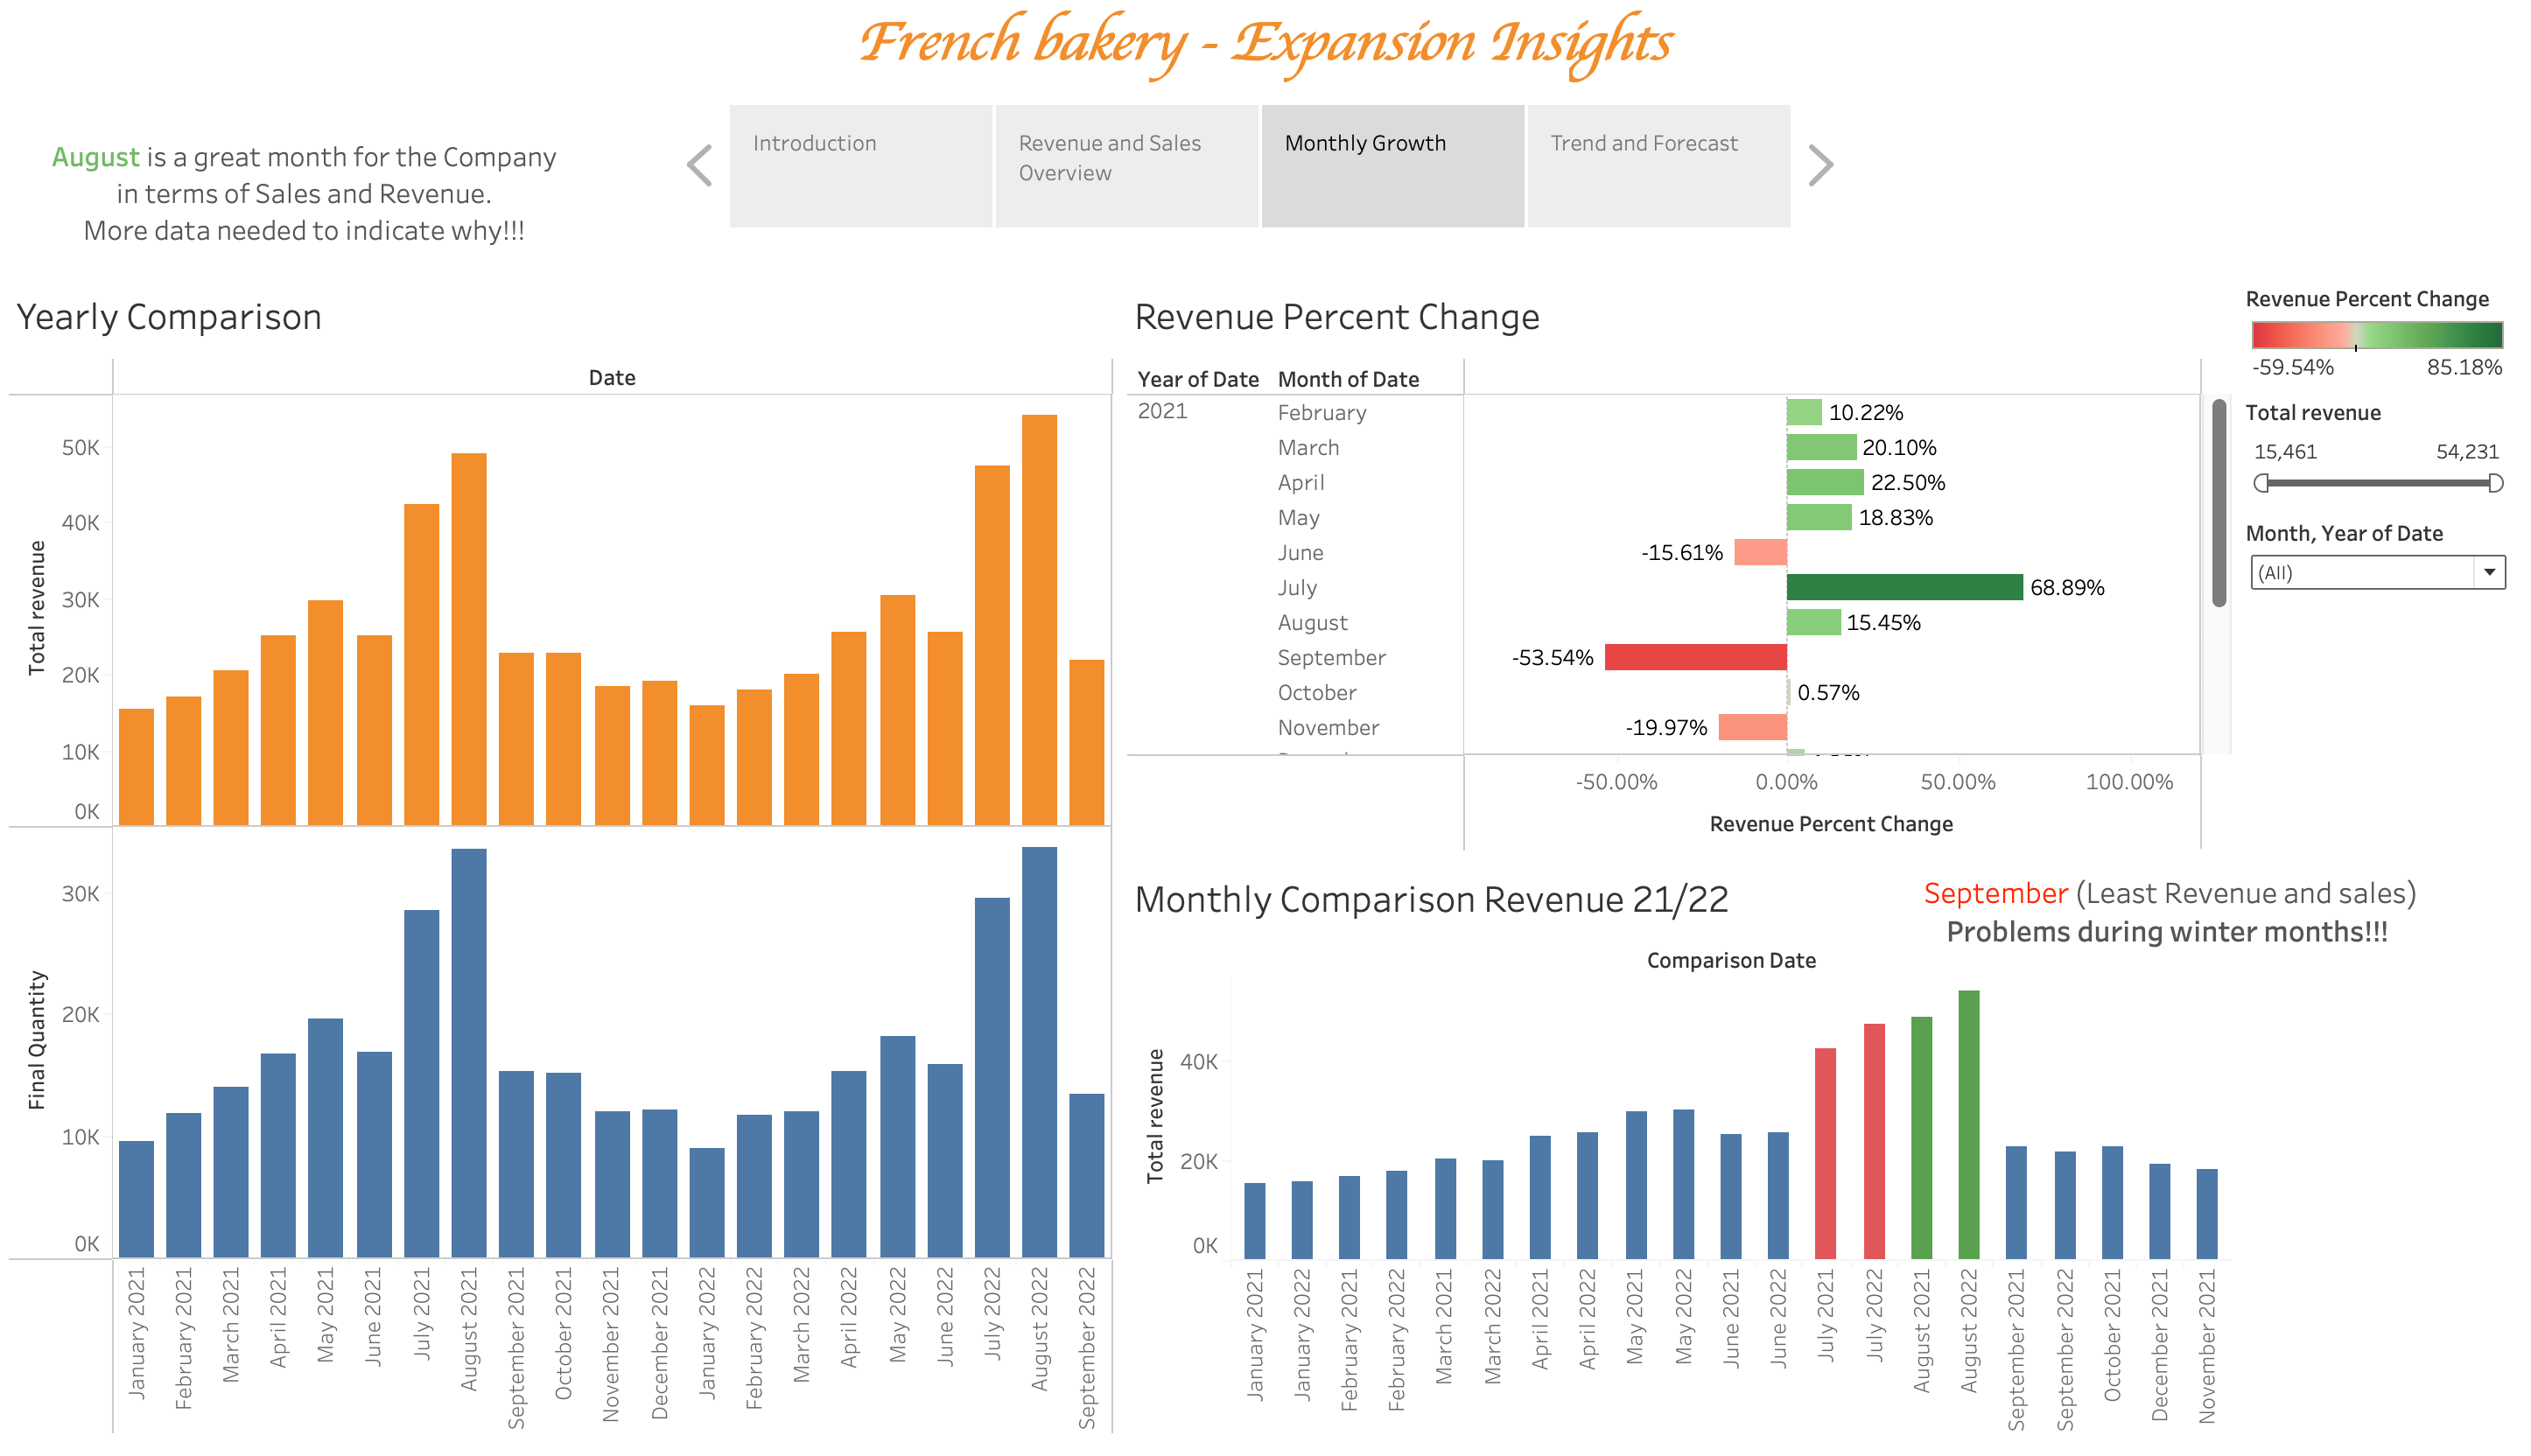
KPI Highlights (2021 & 2022)
| KPI | Value | Description |
|---|---|---|
| Highest Positive Change | +85.18% (Aug 2022) | Highest monthly revenue increase, indicating a strong seasonal peak. |
| Steepest Negative Change | -59.54% (Sep 2022) | Steepest drop in monthly revenue, showing a significant seasonal decline. |
| Consistent Drop Month | September (2021 & 2022) | Consistent monthly revenue decline, highlighting a recurring seasonal pattern. |
| Positive Momentum Month | April & May (Both Years) | Months with consistent growth, indicating a reliable mid-year peak. |
Insights
1. August Volatility: August shows the highest volatility, with a +85.18% increase in 2022, followed by a -59.54% drop in September. This indicates a high-risk, high-reward period.
2. Consistent Growth: February to May shows consistent growth, with April and May consistently showing a 20%+ increase, indicating a reliable mid-year growth phase.
3. High Variability: January and June have high variability, with January 2022 starting with a -17.6% dip and June consistently showing a 15%+ contraction.
4. Weak Q4: Q4 recovery is weak or flat, with October to December showing negligible or negative percent change, indicating a consistent end-of-year slump.
Recommendations
1. Capitalize on August: Use targeted ads and bundle offers leading up to and during August to capitalize on the 85%+ MoM growth. Even a 20% increase in sales during this period could significantly boost annual revenue.
2. Manage September Decline: Proactively manage the September decline with clearance sales and re-engagement campaigns. Given the 59%+ drop, preemptive actions can mitigate significant revenue loss.
3. Stabilize Q1: Stabilize Q1 with incentives and discounts to counter the January and February drops. A 10% increase in sales during these months could offset the typical seasonal decline.
4. Forecast with Dips: Use seasonal dips for forecasting and planning, especially for budgeting and store launches. Accurate prediction can help manage inventory and staffing effectively.
📈 Visual 3: Revenue Trend & Q4 Forecast
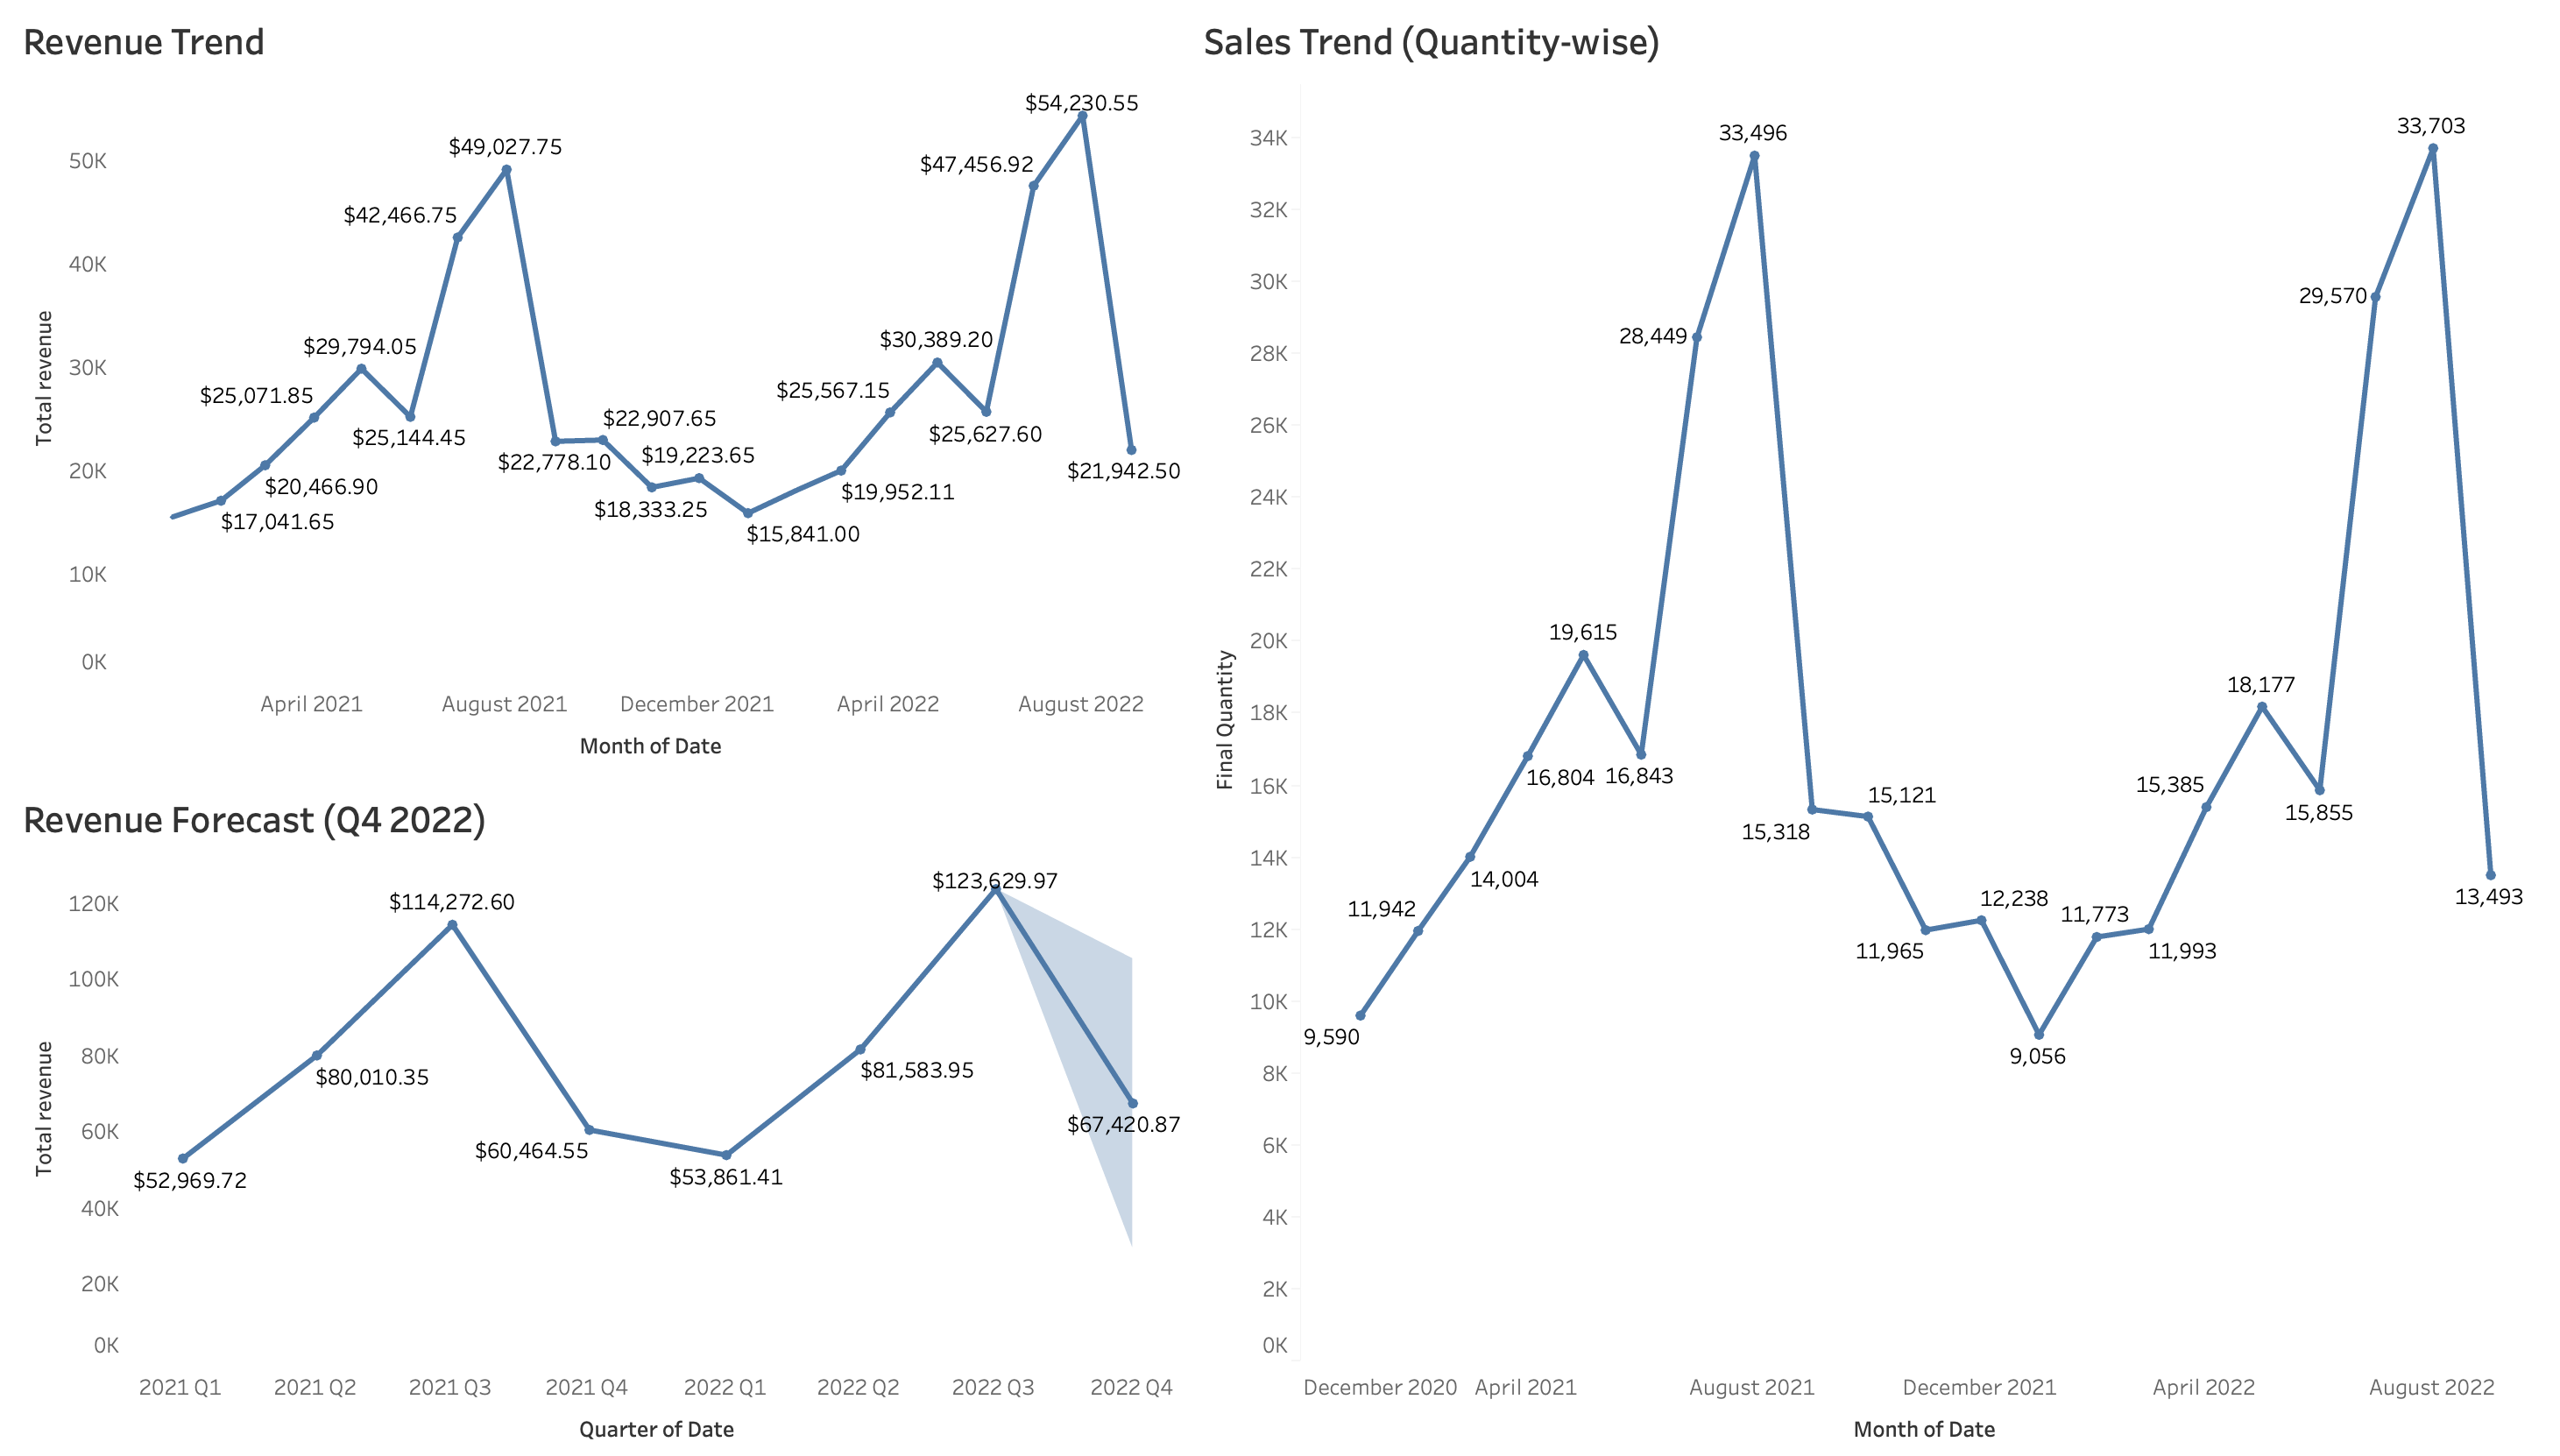
Key Performance Indicators (KPIs):
| KPI | Value | Description |
|---|---|---|
| Monthly Revenue (Max) | $54,230.55 (Aug 2022) | Highest monthly revenue, indicating a peak in seasonal demand. |
| Monthly Revenue (Min) | $15,461.17 (Dec 2020) | Lowest monthly revenue, showing a significant seasonal low. |
| Q4 2022 Forecast | $67,420.87 | Forecasted quarterly revenue, indicating a seasonal dip compared to Q3. |
| Monthly Quantity (Max) | 33,703 units (Aug 2022) | Highest units sold in a month, aligning with revenue peaks. |
| Monthly Quantity (Min) | 9,056 units (Dec 2021) | Lowest units sold in a month, reflecting seasonal low demand. |
Insights
1. Revenue Peak: Revenue peaked in August 2022 at $54,230.55, a 250% increase from December 2020, showing a strong seasonal demand pattern.
2. Sales Correlation: Sales quantity follows revenue trends, with August 2022 having the highest units sold (33,703), indicating a direct correlation between units sold and revenue.
3. Q4 Decline: Q4 2022 forecast is $67,420.87, 45% lower than Q3, indicating a consistent seasonal dip in demand.
Recommendations
1. Focus on Q3: Focus marketing efforts on Q3, especially August, to capitalize on peak demand. A 10% increase in sales during this period could significantly boost annual revenue.
2. Analyze Winter Dips: Analyze winter dips and introduce holiday offers to mitigate the seasonal low. Even a 10% reduction in the Q4 decline could significantly improve quarterly performance.
3. Use Q4 for Planning: Use Q4 for planning and inventory management, given the seasonal decline. Proper resource planning can reduce costs and improve efficiency.
4. Refine Forecasting: Refine forecasting with granular customer data to improve prediction accuracy. Accurate forecasting can help manage inventory and staffing effectively, reducing losses and increasing profitability.