📊 Superstore Dashboard Analysis
📦 Dataset Overview
The analysis is based on the Tableau Superstore dataset, a comprehensive retail dataset that includes order-level data across the United States. It contains information on:
- Orders, Sales, Profit, Discount, Quantity
- Product Categories, Sub-Categories
- Customer Names, Segments, and Regions
- Shipping Modes and Dates
The dataset allows for exploration of both customer-level behavior and region-specific profitability trends.
🛠 Tools Used
- Tableau: For interactive dashboards and visual storytelling
- Excel: For initial data understanding and structure review
- PowerPoint: For summarising insights into stakeholder-friendly presentations
🎯 Project Goal
To uncover key customer and regional profitability drivers using visual analytics.
The primary aim is to:
- Identify high-value and loss-generating customers
- Understand segment- and region-level efficiency
- Enable actionable decisions based on real-time business KPIs like Profit, Sales, and Profit Ratio
Visual 1: Customer Segment Profitability
✅ Key Business Questions
✅ Key Insights (Quantitative & Business-Centric)
- Which regions contribute most to profitability, and which are underperforming?
- Who are the top customers in terms of revenue generation and profit contribution?
- Are there customers with high sales but negative profit margins?
- What is the distribution of customer sales and profit across the U.S.?
- How concentrated is customer profitability — do a few customers drive most of the business?
| KPI | Value | Description |
|---|---|---|
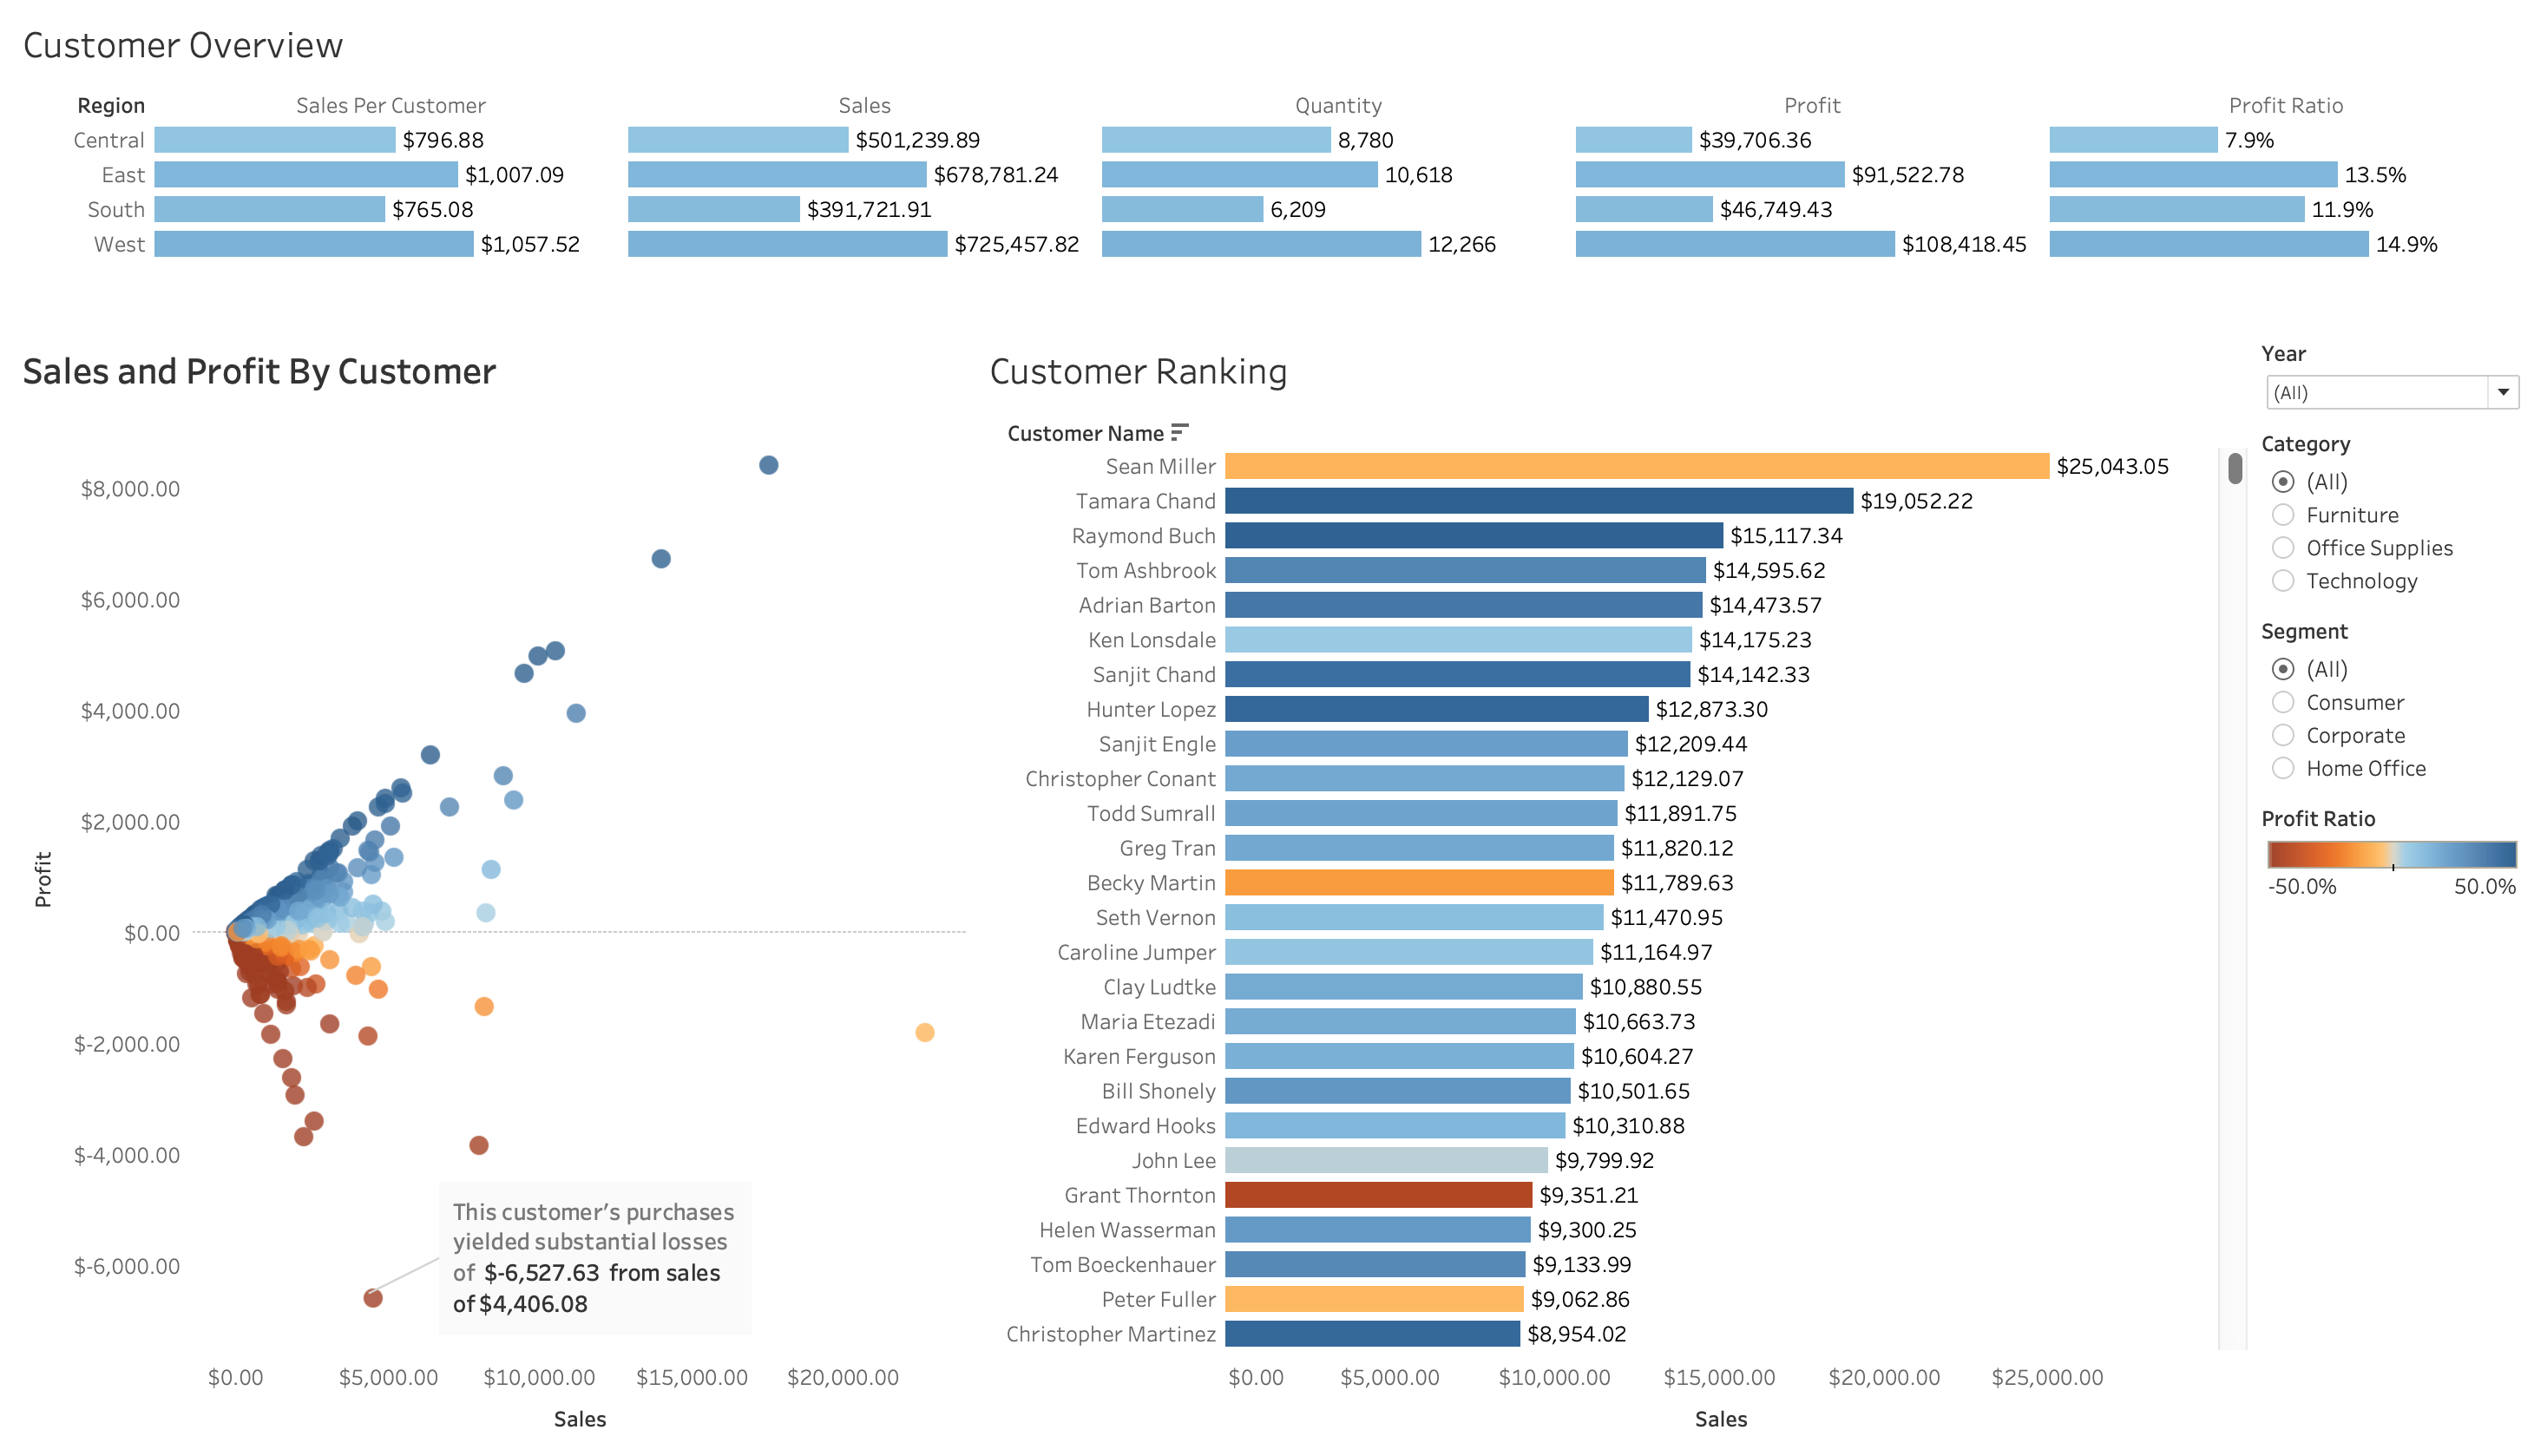
| 🔝 Top Performing Region | West – $108,418 Profit | West recorded the highest overall profit, with a 14.9% profit ratio |
| 🧍♂️ Highest Customer Count | East – 10,618 Customers | East had the largest customer base, though lower efficiency in per-customer sales |
| 💸 Lowest Profit Ratio | Central – 7.9% | Central earned $39,706 profit on $501,239 sales, showing poor margin conversion |
| ⚠️ Top Customer Loss | -$6,527 on $4,406 sales | One customer generated the highest absolute loss with a -148% profit ratio |
| 🥇 Top Customer by Sales | Sean Miller – $25,043 | Highest-grossing customer in terms of revenue |
| 💡 Avg. Sales per Customer (West) | $1,057.52 | The West region has the highest sales per customer, showing strong purchase value |
- West Region Dominates in Profitability
- Generated $725,457 in sales and $108,418 in profit
- Achieved a 14.9% profit ratio, the highest among all regions
- Indicates strong pricing, product mix, and customer behavior efficiency
- East Region Has High Volume, But Lower Efficiency
- Recorded the highest customer count (10,618)
- Despite $678,781 in sales, profit was only $91,522 → Profit ratio: 13.5%
- Sales per customer is only $63.92, compared to $1,057.52 in the West
- Central Region Underperformance
- Sales: $501,239 | Profit: $39,706 | Profit Ratio: 7.9%
- Despite decent sales volume, profit margins are weak → possible issues with cost, returns, or product mix
- Significant Loss-Making Customers Identified
- Example: A customer with $4,406 in sales incurred - $6,527 in losses, i.e., -148% profit ratio
- Such cases severely impact net profitability
- Top Customer Contribution is Disproportionately High
- Sean Miller: $25,043 in sales, followed by Tamara Chand at ~$19K
- Top 10 customers together drive >$130,000 in total sales, showcasing the Pareto principle (20% of customers = 80% of value)
- Visual Scatter of Sales vs Profit Reveals Anomalies
- Clear cluster of loss-generating customers with sales > $3K
- High sales ≠ High profit → highlighting operational inefficiencies, return/refund issues, or over-discounting
💡 Detailed Recommendations (Actionable & Strategic)
- Analyze product mix, delivery methods, discount policy, and customer loyalty initiatives in the West.
- Apply similar strategies to Central and South to improve margin conversion.
- Sales per customer is low despite highest traffic.
- Launch cross-selling bundles, minimum order discount triggers, and targeted loyalty offers to increase average order value.
- Identify customers with sales > $2K and profit < $0.
- Review their order patterns, return rates, and discount usage.
- Set a minimum margin enforcement rule on future sales to such profiles.
- Build a “High-Value Customer Program” for the top 10 clients (e.g., Sean Miller).
- Offer exclusive previews, premium support, and early access to encourage retention and upsell opportunities.
- Despite generating over $500K in sales, the profit ratio is the lowest at 7.9%.
- Audit logistics, fulfillment costs, or underperforming SKUs contributing to the low return.
- Integrate a threshold-based KPI alert system within dashboards (e.g., red flags on negative-profit customers or regions).
- This will support faster decision-making by sales managers and regional leads.
Visual 2: Regional Profitability Analysis
❓ Business Questions
📍 Detailed Insights
- Which shipping modes contribute most to profit, and which drain it?
- Which sub-categories generate losses despite high sales or quantity?
- Which states and cities are key profit drivers or loss centers?
- Do quantity and profit scale together across product types?
- Where should the company cut losses or reinvest to maximise returns?
| KPI | Value | Description |
|---|---|---|
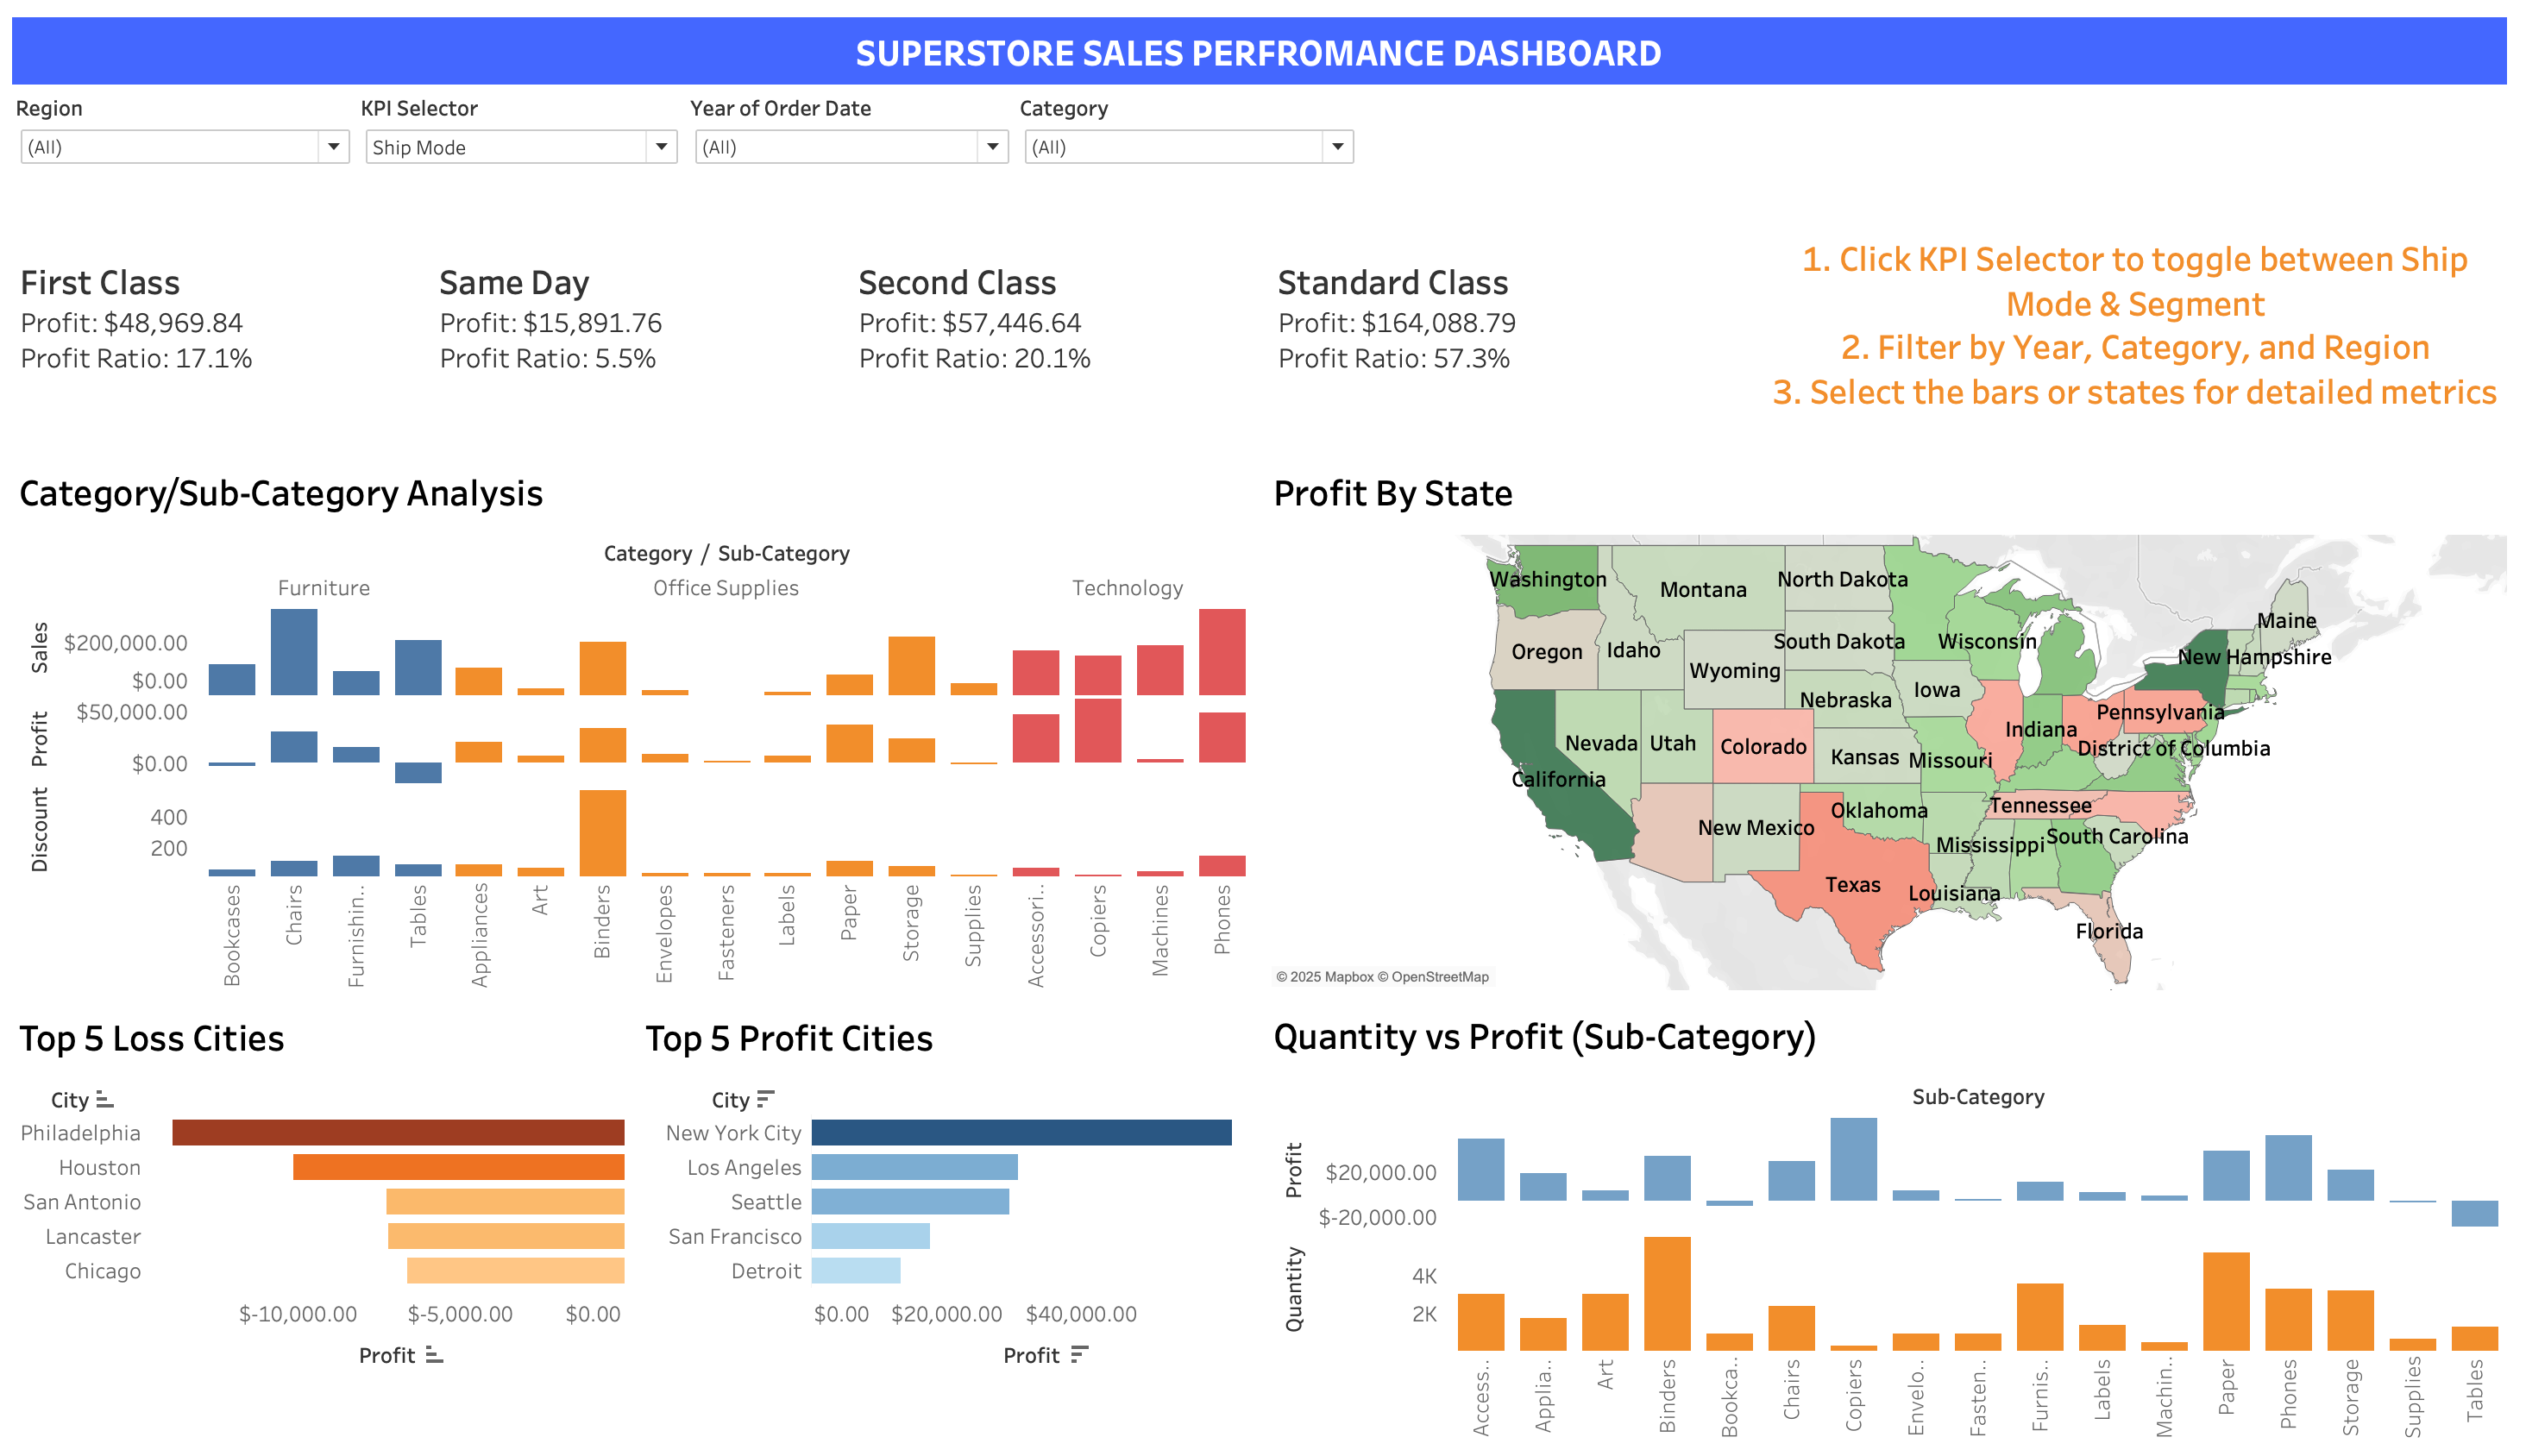
| 🚚 Best Ship Mode | Standard Class – $164,088 | Most profitable and efficient, with 57.3% profit ratio |
| ⚠️ Least Profitable Ship Mode | Same Day – $15,891 | Highest cost-to-serve; only 5.5% profit ratio |
| 🪑 Worst Sub-Category (Profit) | Tables – > -$17,000 loss | Major loss-maker due to deep discounting and poor unit margins |
| 📉 Highest Discount Sub-Category | Binders – Avg. 40%+ discount | High volume, but net loss due to aggressive price cuts |
| 🏆 Top State | California – ~$76,000 profit | Strong revenue-to-margin efficiency |
| 🔴 Worst State | Texas – ~$25,000 loss | High sales, but steep losses — poor cost control or product mix |
| 🏙 Top Profit City | New York City – $50,000+ | Excellent conversion rates and high-value customers |
| 🏙 Top Loss City | Philadelphia – ~ -$13,838 | Urban center with major leakage in profit |
| 📱 Top Performing Product | Phones – High volume + profit | Balanced unit economics, scalable profit source |
-
🔹 1. Shipping Mode Profitability Analysis
- 💡 Insight: Standard Class yielded $164,088.79 in profit with a 57.3% profit ratio, making it the most cost-effective shipping method. In contrast, Same Day shipping contributed only $15,891.76 to profit with a 5.5% profit ratio. First Class and Second Class have moderate performance (~$49K and ~$57K profit respectively).
- 📊 Theory: This reflects the cost-benefit imbalance in faster shipping methods. While customers may opt for quicker delivery, the operational costs (courier, fulfillment, urgency) erode profit margins. Standard Class offers scale efficiency due to batch processing and planned logistics.
-
🔹 2. Sub-Category Profitability Disparity
- 💡 Insight: Tables show consistently negative profits exceeding -$17,000, despite moderate sales volume. Binders, although selling in high volume (~100,000+ units), generated net losses due to average discounting above 40%. Phones and Chairs showed positive margins and strong unit sales — ideal sub-categories for focus.
- 📊 Theory: High volume does not guarantee profitability — especially when paired with high discounts or returns. Retailers should monitor margin per unit rather than sales volume alone. This is a classic Contribution Margin vs Gross Sales dilemma — focusing solely on revenue can hide inefficient product lines.
-
🔹 3. State-Level Profitability Breakdown
- 💡 Insight: California ($76K) and New York ($70K) delivered the highest profits, despite high operational exposure. Texas (~ -$25K) and Illinois (~ -$16K) produced the highest losses among all states. Interestingly, these loss-making states also show high sales, which highlights an issue not of volume, but of margins and cost structure.
- 📊 Theory: This follows Pareto leakage in geographic strategy — some high-volume markets may leak profit due to:
- Excessive discounting
- Higher return rates
- Logistics inefficiency
- Underperforming SKUs specific to the region
-
🔹 4. City-Level Profit Drivers & Bleeders
- 💡 Insight: New York City topped profitability with over $50,000 in profit, making it a strategic location for expansion and customer loyalty efforts. Philadelphia led losses with - $13,838, followed by cities like Houston and San Antonio.
- 📊 Theory: Urban centers like NYC may support premium pricing and high order values, justifying shipping and operational overhead. Loss cities could reflect localized pricing misalignment, or frequent low-margin bulk orders.
-
🔹 5. Quantity vs Profit Relationship
- 💡 Insight: Phones and Chairs showed high quantity and high profit — indicating efficient volume-driven profitability. Tables and Binders, however, showed high sales but negative profits, breaking the expected correlation.
- 📊 Theory: This challenges the assumption of scale economies — without margin control, higher sales can actually lead to loss. This is indicative of over-saturation, deep discounting, or ineffective upselling.
💡 Detailed Recommendations
- Focus on Standard Class as the default for non-urgent orders.
- A 10% volume shift from Same Day to Standard could save $20–30K annually, assuming similar demand profiles.
- Cap Same Day shipping usage based on:
- Order value thresholds
- Customer tier (e.g., only for VIPs)
- 📌 Applies the principle of “Differential Costing” in logistics management.
- Binders and Tables should be reviewed for:
- Discount caps (e.g., max 15–20%)
- SKU rationalization
- Reprice or bundle loss-making items with profitable categories like Phones.
- 📌 Supports Revenue Management strategy: “Discount only what you can afford to lose.”
- Expand campaigns and inventory in California & New York with premium offers.
- For Texas, Illinois, Colorado:
- Perform return/refund audit
- Consider regional pricing adjustments
- 📌 Regionalization strategy – “Act Local, Price Smart.”
- Target New York City, San Francisco, Seattle for:
- Loyalty programs
- Personalized cross-sell offers
- Launch turnaround campaigns in Philadelphia using:
- Minimum order values
- Controlled discount policies
- 📌 Utilizes Geo-Targeting and Micro-Marketing strategies.
- Promote high-profit, high-volume categories (Phones, Chairs) aggressively.
- Re-evaluate the viability of low-profit, high-volume categories (Binders) and high-loss categories (Tables).
- Consider discontinuing or drastically changing the go-to-market for products consistently showing losses.
- 📌 Focuses on "Profit Per Unit" metrics over sheer sales volume.